最近解决了我们项目中的一个内存泄露问题,事实再次证明 pprof 是一个好工具,但掌握好工具的正确用法,才能发挥好工具的威力,不然就算你手里有屠龙刀,也成不了天下第一,本文就是带你用 pprof 定位内存泄露问题。
关于Go的内存泄露有这么一句话不知道你听过没有:
10次内存泄露,有9次是 goroutine 泄露。
我所解决的问题,也是 goroutine 泄露导致的内存泄露,所以这篇文章主要介绍Go程序的goroutine 泄露,掌握了如何定位和解决 goroutine 泄露,就掌握了内存泄露的大部分场景。
本文草稿最初数据都是生产坏境数据,为了防止敏感内容泄露,全部替换成了demo数据,demo的数据比生产环境数据简单多了,更适合入门理解,有助于掌握 pprof。
go pprof基本知识
定位 goroutine 泄露会使用到 pprof,pprof 是Go的性能工具,在开始介绍内存泄露前,先简单介绍下 pprof 的基本使用,更详细的使用给大家推荐了资料。
什么是pprof
pprof 是Go的性能分析工具,在程序运行过程中,可以记录程序的运行信息,可以是CPU使用情况、内存使用情况、goroutine 运行情况等,当需要性能调优或者定位Bug时候,这些记录的信息是相当重要。
基本使用
使用 pprof 有多种方式,Go已经现成封装好了1个:net/http/pprof,使用简单的几行命令,就可以开启 pprof,记录运行信息,并且提供了Web服务,能够通过浏览器和命令行2种方式获取运行数据。
看个最简单的 pprof 的 demo 例子:1
2
3
4
5
6
7
8
9
10
11
12
13
14
15package main
import (
"fmt"
"net/http"
_ "net/http/pprof"
)
func main() {
// 开启pprof,监听请求
ip := "0.0.0.0:6060"
if err := http.ListenAndServe(ip, nil); err != nil {
fmt.Printf("start pprof failed on %s\n", ip)
}
}
浏览器方式
将上述的go pprof例子运行起来后通过浏览器访问: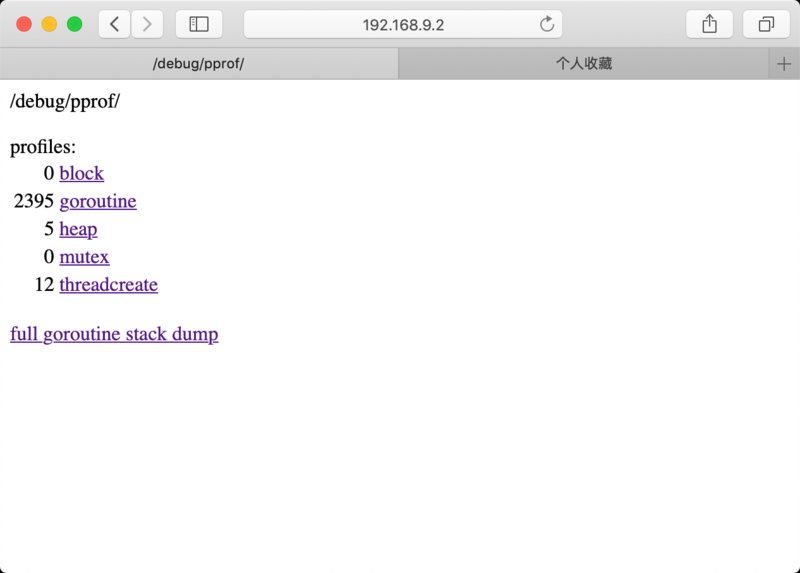
输入网址 http://ip:port/debug/pprof/ 打开pprof主页,从上到下依次是5类profile信息:
- block:goroutine 的阻塞信息,本例就截取自一个 goroutine 阻塞的 demo,但 block 为0,没掌握 block 的用法
- goroutine:所有 goroutine 的信息,下面的
full goroutine stack dump是输出所有 goroutine 的调用栈,是 goroutine 的 debug=2 ,后面会详细介绍。 - heap:堆内存的信息
- mutex:锁的信息
- threadcreate:线程信息
这篇文章我们主要关注 goroutine 和 heap ,这两个都会打印调用栈信息,goroutine 里面还会包含 goroutine 的数量信息,heap 则是内存分配信息,本文用不到的地方就不展示了,最后推荐几篇文章大家去看。
命令行方式
当连接在服务器终端上的时候,是没有浏览器可以使用的,Go提供了命令行的方式,能够获取以上5类信息,这种方式用起来更方便。
使用命令 go tool pprof url 可以获取指定的 profile 文件,此命令会发起 http 请求,然后下载数据到本地,之后进入交互式模式,就像 gdb 一样,可以使用命令查看运行信息,以下是5类请求的方式:1
2
3
4
5
6
7
8
9
10
11
12
13
14
15# 下载cpu profile,默认从当前开始收集30s的cpu使用情况,需要等待30s
go tool pprof http://localhost:6060/debug/pprof/profile # 30-second CPU profile
go tool pprof http://localhost:6060/debug/pprof/profile?seconds=120 # wait 120s
# 下载heap profile
go tool pprof http://localhost:6060/debug/pprof/heap # heap profile
# 下载goroutine profile
go tool pprof http://localhost:6060/debug/pprof/goroutine # goroutine profile
# 下载block profile
go tool pprof http://localhost:6060/debug/pprof/block # goroutine blocking profile
# 下载mutex profile
go tool pprof http://localhost:6060/debug/pprof/mutex
上面的 pprof/demo.go 太简单了,如果去获取内存 profile,几乎获取不到什么,换一个Demo进行内存 profile 的展示:1
2
3
4
5
6
7
8
9
10
11
12
13
14
15
16
17
18
19
20
21
22
23
24
25
26
27
28// 展示内存增长和pprof,并不是泄露
package main
import (
"fmt"
"net/http"
_ "net/http/pprof"
"os"
"time"
)
// 运行一段时间:fatal error: runtime: out of memory
func main() {
// 开启pprof
go func() {
ip := "0.0.0.0:6060"
if err := http.ListenAndServe(ip, nil); err != nil {
fmt.Printf("start pprof failed on %s\n", ip)
os.Exit(1)
}
}()
tick := time.Tick(time.Second / 100)
var buf []byte
for range tick {
buf = append(buf, make([]byte, 1024*1024)...)
}
}
上面这个demo会不断的申请内存,把它编译运行起来,然后执行:1
2
3
4
5
6
7
8
9
10
11
12
13
14
15
16
17
18
19
20
21
22
23
24
25
26
27
28
29
30
31
32
33
34
35
36
37
38
39
40
41
42$ go tool pprof http://localhost:6060/debug/pprof/heap
Fetching profile over HTTP from http://localhost:6060/debug/pprof/heap
Saved profile in /home/ubuntu/pprof/pprof.demo.alloc_objects.alloc_space.inuse_objects.inuse_space.001.pb.gz //<--- 下载到的内存profile文件
File: demo // 程序名称
Build ID: a9069a125ee9c0df3713b2149ca859e8d4d11d5a
Type: inuse_space
Time: May 16, 2019 at 8:55pm (CST)
Entering interactive mode (type "help" for commands, "o" for options)
(pprof)
(pprof)
(pprof) help // 使用help打印所有可用命令
Commands:
callgrind Outputs a graph in callgrind format
comments Output all profile comments
disasm Output assembly listings annotated with samples
dot Outputs a graph in DOT format
eog Visualize graph through eog
evince Visualize graph through evince
gif Outputs a graph image in GIF format
gv Visualize graph through gv
kcachegrind Visualize report in KCachegrind
list Output annotated source for functions matching regexp
pdf Outputs a graph in PDF format
peek Output callers/callees of functions matching regexp
png Outputs a graph image in PNG format
proto Outputs the profile in compressed protobuf format
ps Outputs a graph in PS format
raw Outputs a text representation of the raw profile
svg Outputs a graph in SVG format
tags Outputs all tags in the profile
text Outputs top entries in text form
top Outputs top entries in text form
topproto Outputs top entries in compressed protobuf format
traces Outputs all profile samples in text form
tree Outputs a text rendering of call graph
web Visualize graph through web browser
weblist Display annotated source in a web browser
o/options List options and their current values
quit/exit/^D Exit pprof
....
以上信息我们只关注2个地方:
- 下载得到的文件:
/home/ubuntu/pprof/pprof.demo.alloc_objects.alloc_space.inuse_objects.inuse_space.001.pb.gz,这其中包含了程序名demo,profile 类型alloc已分配的内存,inuse代表使用中的内存。 help可以获取帮助,最先会列出支持的命令,想掌握 pprof,要多看看,多尝试。
关于命令,本文只会用到3个,我认为也是最常用的:top、list、traces,分别介绍一下。
top
按指标大小列出前10个函数,比如内存是按内存占用多少,CPU是按执行时间多少。1
2
3
4
5(pprof) top
Showing nodes accounting for 814.62MB, 100% of 814.62MB total
flat flat% sum% cum cum%
814.62MB 100% 100% 814.62MB 100% main.main
0 0% 100% 814.62MB 100% runtime.main
top会列出5个统计数据:
- flat: 本函数占用的内存量。
- flat%: 本函数内存占使用中内存总量的百分比。
- sum%: 前面每一行 flat 百分比的和,比如第2行虽然的100% 是 100% + 0%。
- cum: 是累计量,加入main函数调用了函数f,函数f占用的内存量,也会记进来。
- cum%: 是累计量占总量的百分比。
list
查看某个函数的代码,以及该函数每行代码的指标信息,如果函数名不明确,会进行模糊匹配,比如 list main 会列出 main.main 和 runtime.main。1
2
3
4
5
6
7
8
9
10
11
12
13
14
15
16
17
18
19
20
21
22
23
24
25(pprof) list main.main // 精确列出函数
Total: 814.62MB
ROUTINE ======================== main.main in /home/ubuntu/heap/demo2.go
814.62MB 814.62MB (flat, cum) 100% of Total
. . 20: }()
. . 21:
. . 22: tick := time.Tick(time.Second / 100)
. . 23: var buf []byte
. . 24: for range tick {
814.62MB 814.62MB 25: buf = append(buf, make([]byte, 1024*1024)...)
. . 26: }
. . 27:}
. . 28:
(pprof) list main // 匹配所有函数名带main的函数
Total: 814.62MB
ROUTINE ======================== main.main in /home/ubuntu/heap/demo2.go
814.62MB 814.62MB (flat, cum) 100% of Total
. . 20: }()
. . 21:
..... // 省略几行
. . 28:
ROUTINE ======================== runtime.main in /usr/lib/go-1.10/src/runtime/proc.go
0 814.62MB (flat, cum) 100% of Total
. . 193: // A program compiled with -buildmode=c-archive or c-shared
..... // 省略几行
可以看到在 main.main 中的第25行占用了814.62MB内存,左右2个数据分别是 flat 和cum,含义和 top 中解释的一样。
traces
打印所有调用栈,以及调用栈的指标信息。1
2
3
4
5
6
7
8
9
10
11
12
13(pprof) traces
File: demo2
Type: inuse_space
Time: May 16, 2019 at 7:08pm (CST)
-----------+-------------------------------------------------------
bytes: 813.46MB
813.46MB main.main
runtime.main
-----------+-------------------------------------------------------
bytes: 650.77MB
0 main.main
runtime.main
....... // 省略几十行
每个 - - - - - 隔开的是一个调用栈,能看到 runtime.main 调用了 main.main,并且 main.main 中占用了813.46MB内存。
其他的 profile 操作和内存是类似的,这里就不展示了。
这里只是简单介绍本文用到的 pprof 的功能,pprof 功能很强大,也经常和 benchmark 结合起来,但这不是本文的重点,所以就不多介绍了,为大家推荐几篇文章,一定要好好研读、实践:
- Go官方博客关于pprof的介绍,很详细,也包含样例,可以实操:Profiling Go Programs。
- 煎鱼的这篇文章也很适合入门: Golang 大杀器之性能剖析 PProf。
什么是内存泄露
内存泄露指的是程序运行过程中已不再使用的内存,没有被释放掉,导致这些内存无法被使用,直到程序结束这些内存才被释放的问题。
Go虽然有 GC 来回收不再使用的堆内存,减轻了开发人员对内存的管理负担,但这并不意味着Go程序不再有内存泄露问题。在Go程序中,如果没有Go语言的编程思维,也不遵守良好的编程实践,就可能埋下隐患,造成内存泄露问题。
怎么发现内存泄露
在Go中发现内存泄露有2种方法,一个是通用的监控工具,另一个是 go pprof:
- 监控工具:固定周期对进程的内存占用情况进行采样,数据可视化后,根据内存占用走势(持续上升),很容易发现是否发生内存泄露。
- go pprof:适合没有监控工具的情况,使用Go提供的 pprof 工具判断是否发生内存泄露。
这2种方式分别介绍一下。
监控工具查看进程内在占用情况
如果使用云平台部署Go程序,云平台都提供了内存查看的工具,可以查看OS的内存占用情况和某个进程的内存占用情况,比如阿里云,我们在1个云主机上只部署了1个Go服务,所以OS的内存占用情况,基本是也反映了进程内存占用情况,OS内存占用情况如下,可以看到随着时间的推进,内存的占用率在不断的提高,这是内存泄露的最明显现象:
如果没有云平台这种内存监控工具,可以制作一个简单的内存记录工具。
1、建立一个脚本 prog_mem.sh,获取进程占用的物理内存情况,脚本内容如下:1
2
3
4
5
prog_name="your_programe_name"
prog_mem=$(pidstat -r -u -h -C $prog_name |awk 'NR==4{print $12}')
time=$(date "+%Y-%m-%d %H:%M:%S")
echo $time"\tmemory(Byte)\t"$prog_mem >>/root/prog_mem.log
2、然后使用 crontab 建立定时任务,每分钟记录1次。使用 crontab -e 编辑crontab 配置,在最后增加1行1
*/1 * * * * /root/prog_mem.sh
脚本输出的内容保存在 prog_mem.log,只要大体浏览一下就可以发现内存的增长情况,判断是否存在内存泄露。如果需要可视化,可以直接黏贴 prog_mem.log 内容到 Excel 等表格工具,绘制内存占用图。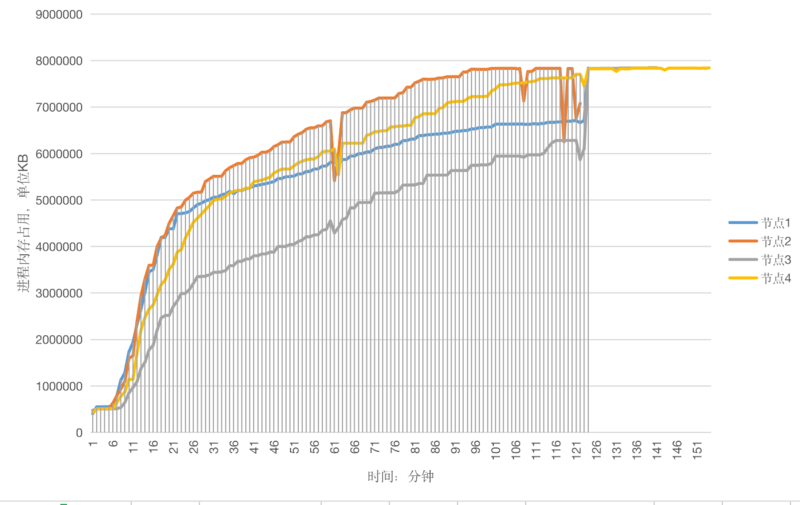
go pprof发现存在内存问题
有情提醒:如果对 pprof 不了解,可以先看 go pprof 基本知识
如果你 Google 或者百度,Go程序内存泄露的文章,它总会告诉你使用 pprof heap,能够生成漂亮的调用路径图,火焰图等等,然后你根据调用路径就能定位内存泄露问题,我最初也是对此深信不疑,尝试了若干天后,只是发现内存泄露跟某种场景有关,根本找不到内存泄露的根源,如果哪位朋友用heap就能定位内存泄露的线上问题,麻烦介绍下。
后来读了 Dave 的《High Performance Go Workshop》,刷新了对 heap 的认识,内存pprof 的简要内容如下: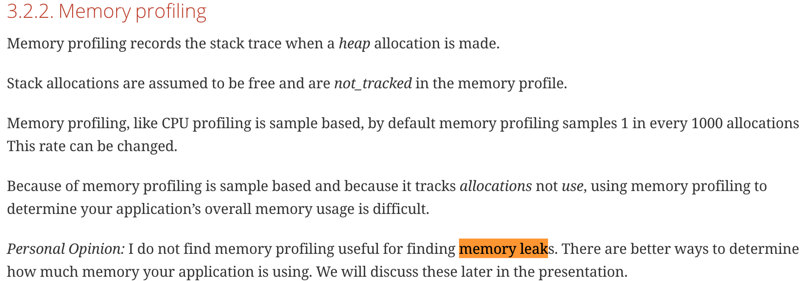
Dave讲了以下几点:
- 内存 profiling 记录的是堆内存分配的情况,以及调用栈信息,并不是进程完整的内存情况,猜测这也是在 go pprof 中称为 heap 而不是 memory 的原因。
- 栈内存的分配是在调用栈结束后会被释放的内存,所以并不在内存 profile 中。
- 内存 profiling 是基于抽样的,默认是每1000次堆内存分配,执行1次 profile 记录。
- 因为内存 profiling 是基于抽样和它跟踪的是已分配的内存,而不是使用中的内存,(比如有些内存已经分配,看似使用,但实际以及不使用的内存,比如内存泄露的那部分),所以不能使用内存 profiling 衡量程序总体的内存使用情况。
- Dave 个人观点:使用内存 profiling 不能够发现内存泄露。
基于目前对 heap 的认知,我有2个观点:
- heap 能帮助我们发现内存问题,但不一定能发现内存泄露问题,这个看法与 Dave 是类似的。heap 记录了内存分配的情况,我们能通过 heap 观察内存的变化,增长与减少,内存主要被哪些代码占用了,程序存在内存问题,这只能说明内存有使用不合理的地方,但并不能说明这是内存泄露。
- heap 在帮助定位内存泄露原因上贡献的力量微乎其微。如第一条所言,能通过 heap 找到占用内存多的位置,但这个位置通常不一定是内存泄露,就算是内存泄露,也只是内存泄露的结果,并不是真正导致内存泄露的根源。
接下来,我介绍怎么用 heap 发现问题,然后再解释为什么 heap 几乎不能定位内存泄露的根因。
怎么用heap发现内存问题
使用 pprof 的 heap 能够获取程序运行时的内存信息,在程序平稳运行的情况下,每个一段时间使用 heap 获取内存的 profile ,然后使用 base 能够对比两个 profile 文件的差别,就像 diff 命令一样显示出增加和减少的变化,使用一个简单的demo来说明 heap 和 base 的使用,依然使用demo2进行展示。1
2
3
4
5
6
7
8
9
10
11
12
13
14
15
16
17
18
19
20
21
22
23
24
25
26
27
28// 展示内存增长和pprof,并不是泄露
package main
import (
"fmt"
"net/http"
_ "net/http/pprof"
"os"
"time"
)
// 运行一段时间:fatal error: runtime: out of memory
func main() {
// 开启pprof
go func() {
ip := "0.0.0.0:6060"
if err := http.ListenAndServe(ip, nil); err != nil {
fmt.Printf("start pprof failed on %s\n", ip)
os.Exit(1)
}
}()
tick := time.Tick(time.Second / 100)
var buf []byte
for range tick {
buf = append(buf, make([]byte, 1024*1024)...)
}
}
将上面代码运行起来,执行以下命令获取 profile 文件,Ctrl-D 退出,1分钟后再获取1次。1
go tool pprof http://localhost:6060/debug/pprof/heap
我已经获取到了两个 profile 文件:1
2
3$ ls
pprof.demo2.alloc_objects.alloc_space.inuse_objects.inuse_space.001.pb.gz
pprof.demo2.alloc_objects.alloc_space.inuse_objects.inuse_space.002.pb.gz
使用 base 把001文件作为基准,然后用002和001对比,先执行 top 看 top 的对比,然后执行 list main 列出 main 函数的内存对比,结果如下:1
2
3
4
5
6
7
8
9
10
11
12
13
14
15
16
17
18
19
20
21
22
23
24
25
26
27
28$ go tool pprof -base pprof.demo2.alloc_objects.alloc_space.inuse_objects.inuse_space.001.pb.gz pprof.demo2.alloc_objects.alloc_space.inuse_objects.inuse_space.002.pb.gz
File: demo2
Type: inuse_space
Time: May 14, 2019 at 2:33pm (CST)
Entering interactive mode (type "help" for commands, "o" for options)
(pprof)
(pprof)
(pprof) top
Showing nodes accounting for 970.34MB, 32.30% of 3003.99MB total
flat flat% sum% cum cum%
970.34MB 32.30% 32.30% 970.34MB 32.30% main.main // 看这
0 0% 32.30% 970.34MB 32.30% runtime.main
(pprof)
(pprof)
(pprof) list main.main
Total: 2.93GB
ROUTINE ======================== main.main in /home/ubuntu/heap/demo2.go
970.34MB 970.34MB (flat, cum) 32.30% of Total
. . 20: }()
. . 21:
. . 22: tick := time.Tick(time.Second / 100)
. . 23: var buf []byte
. . 24: for range tick {
970.34MB 970.34MB 25: buf = append(buf, make([]byte, 1024*1024)...) // 看这
. . 26: }
. . 27:}
. . 28:
top 列出了 main.main 和 runtime.main,main.main 就是我们编写的 main函数,runtime.main 是 runtime 包中的 main 函数,也就是所有 main 函数的入口,这里不多介绍了,有兴趣可以看之前的调度器文章《Go调度器系列(2)宏观看调度器》。
top 显示 main.main 第2次内存占用,比第1次内存占用多了970.34MB。
list main.main 告诉了我们增长的内存都在这一行:1
buf = append(buf, make([]byte, 1024*1024)...)
001和002 profile 的文件不进去看了,你本地测试下计算差值,绝对是刚才对比出的970.34MB。
heap“不能”定位内存泄露
heap 能显示内存的分配情况,以及哪行代码占用了多少内存,我们能轻易的找到占用内存最多的地方,如果这个地方的数值还在不断怎大,基本可以认定这里就是内存泄露的位置。
曾想按图索骥,从内存泄露的位置,根据调用栈向上查找,总能找到内存泄露的原因,这种方案看起来是不错的,但实施起来却找不到内存泄露的原因,结果是事半功倍。
原因在于一个Go程序,其中有大量的 goroutine,这其中的调用关系也许有点复杂,也许内存泄露是在某个三方包里。举个栗子,比如下面这幅图,每个椭圆代表1个 goroutine,其中的数字为编号,箭头代表调用关系。heap profile 显示 g111(最下方标红节点)这个协程的代码出现了泄露,任何一个从 g101 到 g111 的调用路径都可能造成了 g111 的内存泄露,有2类可能:
- 该 goroutine 只调用了少数几次,但消耗了大量的内存,说明每个 goroutine 调用都消耗了不少内存,内存泄露的原因基本就在该协程内部。
- 该 goroutine 的调用次数非常多,虽然每个协程调用过程中消耗的内存不多,但该调用路径上,协程数量巨大,造成消耗大量的内存,并且这些 goroutine 由于某种原因无法退出,占用的内存不会释放,内存泄露的原因在到 g111 调用路径上某段代码实现有问题,造成创建了大量的 g111。
第2种情况,就是 goroutine 泄露,这是通过 heap 无法发现的,所以 heap 在定位内存泄露这件事上,发挥的作用不大。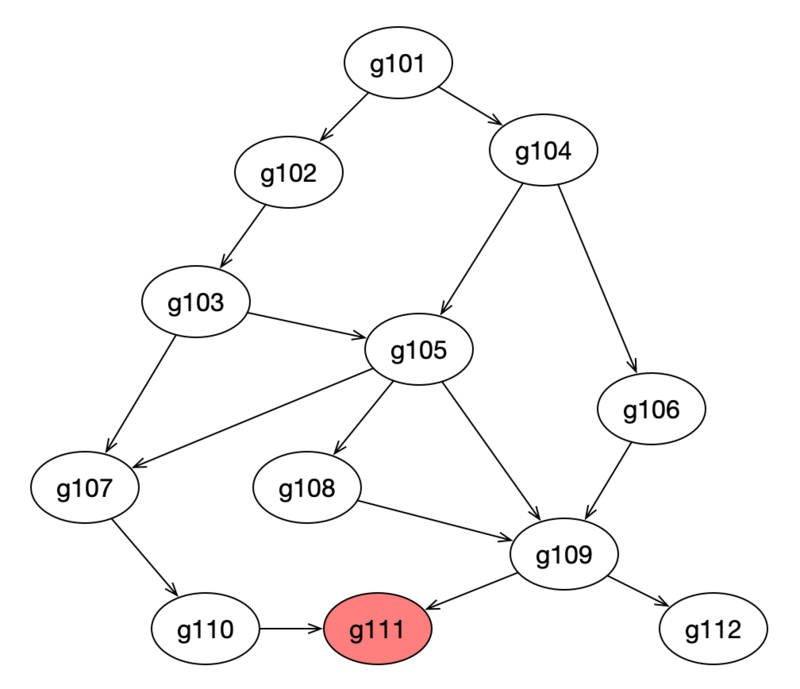
goroutine 泄露怎么导致内存泄露
什么是 goroutine 泄露
如果你启动了1个 goroutine,但并没有符合预期的退出,直到程序结束,此 goroutine 才退出,这种情况就是 goroutine 泄露。
提前思考:什么会导致 goroutine 无法退出/阻塞?
goroutine 泄露怎么导致内存泄露
每个 goroutine 占用 2KB 内存,泄露1百万 goroutine 至少泄露 2KB * 1000000 = 2GB 内存,为什么说至少呢?
goroutine 执行过程中还存在一些变量,如果这些变量指向堆内存中的内存,GC会认为这些内存仍在使用,不会对其进行回收,这些内存谁都无法使用,造成了内存泄露。
所以 goroutine 泄露有2种方式造成内存泄露:
- goroutine 本身的栈所占用的空间造成内存泄露。
- goroutine 中的变量所占用的堆内存导致堆内存泄露,这一部分是能通过 heap profile 体现出来的。
Dave 在文章中也提到了,如果不知道何时停止一个 goroutine ,这个 goroutine 就是潜在的内存泄露:
7.1.1 Know when to stop a goroutine
If you don’t know the answer, that’s a potential memory leak as the goroutine will pin its stack’s memory on the heap, as well as any heap allocated variables reachable from the stack.
怎么确定是goroutine泄露引发的内存泄露
掌握了前面的 pprof 命令行的基本用法,很快就可以确认是否是 goroutine 泄露导致内存泄露。
判断依据:在节点正常运行的情况下,隔一段时间获取 goroutine 的数量,如果后面获取的那次,某些 goroutine 比前一次多,如果多获取几次,是持续增长的,就极有可能是goroutine 泄露。
goroutine 导致内存泄露的 demo:1
2
3
4
5
6
7
8
9
10
11
12
13
14
15
16
17
18
19
20
21
22
23
24
25
26
27
28
29
30
31
32
33
34
35
36
37
38
39
40
41
42
43
44
45
46
47
48
49
50
51
52
53
54
55// goroutine泄露导致内存泄露
package main
import (
"fmt"
"net/http"
_ "net/http/pprof"
"os"
"time"
)
func main() {
// 开启pprof
go func() {
ip := "0.0.0.0:6060"
if err := http.ListenAndServe(ip, nil); err != nil {
fmt.Printf("start pprof failed on %s\n", ip)
os.Exit(1)
}
}()
outCh := make(chan int)
// 死代码,永不读取
go func() {
if false {
<-outCh
}
select {}
}()
// 每s起100个goroutine,goroutine会阻塞,不释放内存
tick := time.Tick(time.Second / 100)
i := 0
for range tick {
i++
fmt.Println(i)
alloc1(outCh)
}
}
func alloc1(outCh chan<- int) {
go alloc2(outCh)
}
func alloc2(outCh chan<- int) {
func() {
defer fmt.Println("alloc-fm exit")
// 分配内存,借用一下
buf := make([]byte, 1024*1024*10)
_ = len(buf)
fmt.Println("alloc done")
outCh <- 0 // 53行
}()
}
编译并运行以上代码,然后使用 go tool pprof 获取 gorourine 的 profile 文件。1
go tool pprof http://localhost:6060/debug/pprof/goroutine
已经通过 pprof 命令获取了2个 goroutine 的 profile 文件:1
2
3$ ls
/home/ubuntu/pprof/pprof.leak_demo.goroutine.001.pb.gz
/home/ubuntu/pprof/pprof.leak_demo.goroutine.002.pb.gz
同 heap 一样,我们可以使用 base 对比2个 goroutine profile 文件:1
2
3
4
5
6
7
8
9
10
11
12
13
14
15
16
17$go tool pprof -base pprof.leak_demo.goroutine.001.pb.gz pprof.leak_demo.goroutine.002.pb.gz
File: leak_demo
Type: goroutine
Time: May 16, 2019 at 2:44pm (CST)
Entering interactive mode (type "help" for commands, "o" for options)
(pprof)
(pprof) top
Showing nodes accounting for 20312, 100% of 20312 total
flat flat% sum% cum cum%
20312 100% 100% 20312 100% runtime.gopark
0 0% 100% 20312 100% main.alloc2
0 0% 100% 20312 100% main.alloc2.func1
0 0% 100% 20312 100% runtime.chansend
0 0% 100% 20312 100% runtime.chansend1
0 0% 100% 20312 100% runtime.goparkunlock
(pprof)
可以看到运行到 runtime.gopark 的 goroutine 数量增加了20312个。再通过002文件,看一眼执行到 gopark 的 goroutine 数量,即挂起的 goroutine 数量:1
2
3
4
5
6
7
8
9
10
11
12
13
14
15go tool pprof pprof.leak_demo.goroutine.002.pb.gz
File: leak_demo
Type: goroutine
Time: May 16, 2019 at 2:47pm (CST)
Entering interactive mode (type "help" for commands, "o" for options)
(pprof) top
Showing nodes accounting for 24330, 100% of 24331 total
Dropped 32 nodes (cum <= 121)
flat flat% sum% cum cum%
24330 100% 100% 24330 100% runtime.gopark
0 0% 100% 24326 100% main.alloc2
0 0% 100% 24326 100% main.alloc2.func1
0 0% 100% 24326 100% runtime.chansend
0 0% 100% 24326 100% runtime.chansend1
0 0% 100% 24327 100% runtime.goparkunlock
显示有24330个 goroutine 被挂起,这不是 goroutine 泄露这是啥?已经能确定八九成goroutine 泄露了。
是什么导致如此多的 goroutine 被挂起而无法退出?接下来就看怎么定位 goroutine 泄露。
定位goroutine泄露的2种方法
使用 pprof 有2种方式,一种是web网页,一种是 go tool pprof 命令行交互,这两种方法查看 goroutine 都支持,但有轻微不同,也有各自的优缺点。
我们先看Web的方式,再看命令行交互的方式,这两种都很好使用,结合起来用也不错。
Web可视化查看
Web方式适合web服务器的端口能访问的情况,使用起来方便,有2种方式:
- 查看某条调用路径上,当前阻塞在此 goroutine 的数量
- 查看所有 goroutine 的运行栈(调用路径),可以显示阻塞在此的时间
方式一
url请求中设置debug=1:1
http://ip:port/debug/pprof/goroutine?debug=1
效果如下: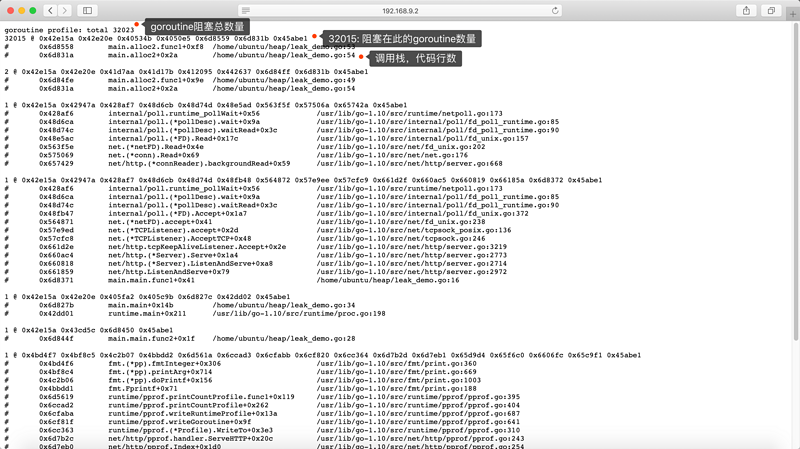
看起来密密麻麻的,其实简单又十分有用,看上图标出来的部分,手机上图看起来可能不方便,那就放大图片,或直接看下面各字段的含义:
goroutine profile: total 32023:32023 是 goroutine 的总数量32015 @ 0x42e15a 0x42e20e 0x40534b 0x4050e5 ...:32015 代表当前有32015 个 goroutine 运行这个调用栈,并且停在相同位置,@后面的十六进制,现在用不到这个数据,所以暂不深究了- 下面是当前 goroutine 的调用栈,列出了函数和所在文件的行数,这个行数对定位很有帮助,如下:
1
2
332015 @ 0x42e15a 0x42e20e 0x40534b 0x4050e5 0x6d8559 0x6d831b 0x45abe1
# 0x6d8558 main.alloc2.func1+0xf8 /home/ubuntu/heap/leak_demo.go:53
# 0x6d831a main.alloc2+0x2a /home/ubuntu/heap/leak_demo.go:54
根据上面的提示,就能判断32015个 goroutine 运行到 leak_demo.go 的53行:1
2
3
4
5
6
7
8
9
10
11func alloc2(outCh chan<- int) {
func() {
defer fmt.Println("alloc-fm exit")
// 分配内存,假用一下
buf := make([]byte, 1024*1024*10)
_ = len(buf)
fmt.Println("alloc done")
outCh <- 0 // 53行
}()
}
阻塞的原因是 outCh 这个写操作无法完成,outCh 是无缓冲的通道,并且由于以下代码是死代码,所以 goroutine 始终没有从 outCh 读数据,造成 outCh 阻塞,进而造成无数个alloc2 的 goroutine 阻塞,形成内存泄露:1
2
3if false {
<-outCh
}
方式二
url 请求中设置 debug=2 :1
http://ip:port/debug/pprof/goroutine?debug=2
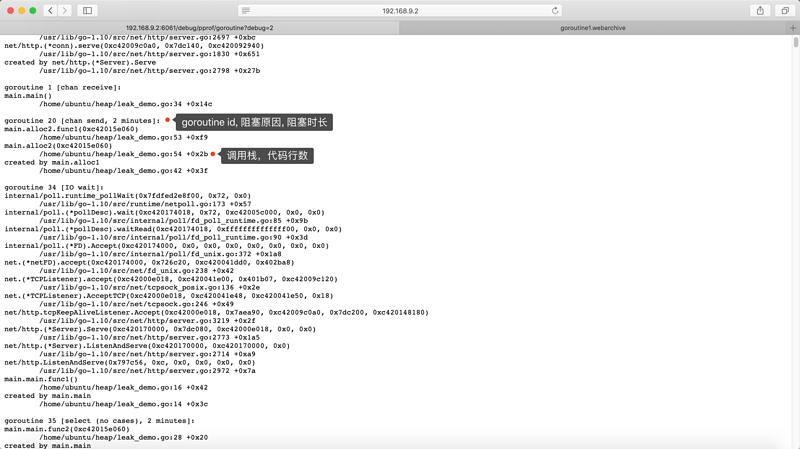
第2种方式和第1种方式是互补的,它可以看到每个 goroutine 的信息:
goroutine 20 [chan send, 2 minutes]:20 是 goroutine id,[]中是当前goroutine 的状态,阻塞在写 channel ,并且阻塞了2分钟,长时间运行的系统,你能看到阻塞时间更长的情况。- 同时,也可以看到调用栈,看当前执行停到哪了:
leak_demo.go的53行1
2
3
4
5
6
7goroutine 20 [chan send, 2 minutes]:
main.alloc2.func1(0xc42015e060)
/home/ubuntu/heap/leak_demo.go:53 +0xf9 // 这
main.alloc2(0xc42015e060)
/home/ubuntu/heap/leak_demo.go:54 +0x2b
created by main.alloc1
/home/ubuntu/heap/leak_demo.go:42 +0x3f
命令行交互式方法
Web的方法是简单粗暴,无需登录服务器,浏览器打开看看就行了。但就像前面提的,没有浏览器可访问时,命令行交互式才是最佳的方式,并且也是手到擒来,感觉比Web一样方便。
命令行交互式只有1种获取 goroutine profile 的方法,不像Web网页分 debug=1 和debug=2 2种方式,并将 profile 文件保存到本地:1
2
3
4
5
6
7
8
9// 注意命令没有`debug=1`,debug=1,加debug有些版本的go不支持
$ go tool pprof http://0.0.0.0:6060/debug/pprof/goroutine
Fetching profile over HTTP from http://localhost:6061/debug/pprof/goroutine
Saved profile in /home/ubuntu/pprof/pprof.leak_demo.goroutine.001.pb.gz // profile文件保存位置
File: leak_demo
Type: goroutine
Time: May 16, 2019 at 2:44pm (CST)
Entering interactive mode (type "help" for commands, "o" for options)
(pprof)
命令行只需要掌握3个命令就好了,上面介绍过了,详细的倒回去看 top, list, traces:
- top:显示正运行到某个函数 goroutine 的数量
- traces:显示所有 goroutine 的调用栈
- list:列出代码详细的信息。
我们依然使用 leak_demo.go 这个demo1
2
3
4
5
6
7
8
9
10
11
12
13
14
15
16
17
18
19
20
21
22
23
24
25
26
27
28
29$ go tool pprof -base pprof.leak_demo.goroutine.001.pb.gz pprof.leak_demo.goroutine.002.pb.gz
File: leak_demo
Type: goroutine
Time: May 16, 2019 at 2:44pm (CST)
Entering interactive mode (type "help" for commands, "o" for options)
(pprof)
(pprof)
(pprof) top
Showing nodes accounting for 20312, 100% of 20312 total
flat flat% sum% cum cum%
20312 100% 100% 20312 100% runtime.gopark
0 0% 100% 20312 100% main.alloc2
0 0% 100% 20312 100% main.alloc2.func1
0 0% 100% 20312 100% runtime.chansend
0 0% 100% 20312 100% runtime.chansend1
0 0% 100% 20312 100% runtime.goparkunlock
(pprof)
(pprof) traces
File: leak_demo
Type: goroutine
Time: May 16, 2019 at 2:44pm (CST)
-----------+-------------------------------------------------------
20312 runtime.gopark
runtime.goparkunlock
runtime.chansend
runtime.chansend1 // channel发送
main.alloc2.func1 // alloc2中的匿名函数
main.alloc2
-----------+-------------------------------------------------------
top 命令在怎么确定是 goroutine 泄露引发的内存泄露介绍过了,直接看 traces 命令,traces 能列出002中比001中多的那些 goroutine 的调用栈,这里只有1个调用栈,有20312个 goroutine 都执行这个调用路径,可以看到 alloc2 中的匿名函数 alloc2.func1 调用了写 channel 的操作,然后阻塞挂起了 goroutine,使用 list 列出 alloc2.func1 的代码,显示有20312个 goroutine 阻塞在53行:1
2
3
4
5
6
7
8
9
10
11
12
13(pprof) list main.alloc2.func1
Total: 20312
ROUTINE ======================== main.alloc2.func1 in /home/ubuntu/heap/leak_demo.go
0 20312 (flat, cum) 100% of Total
. . 48: // 分配内存,假用一下
. . 49: buf := make([]byte, 1024*1024*10)
. . 50: _ = len(buf)
. . 51: fmt.Println("alloc done")
. . 52:
. 20312 53: outCh <- 0 // 看这
. . 54: }()
. . 55:}
. . 56:
友情提醒:使用list命令的前提是程序的源码在当前机器,不然可没法列出源码。服务器上,通常没有源码,那我们咋办呢?刚才介绍了Web查看的方式,那里会列出代码行数,我们可以使用 wget 下载网页:1
$ wget http://localhost:6060/debug/pprof/goroutine?debug=1
下载网页后,使用编辑器打开文件,使用关键字 main.alloc2.func1 进行搜索,找到与当前相同的调用栈,就可以看到该 goroutine 阻塞在哪一行了,不要忘记使用 debug=2 还可以看到阻塞了多久和原因,Web方式中已经介绍了,此处省略代码几十行。
总结
goroutine 泄露的本质
goroutine 泄露的本质是 channel 阻塞,无法继续向下执行,导致此 goroutine 关联的内存都无法释放,进一步造成内存泄露。
goroutine 泄露的发现和定位
利用好 go pprof 获取 goroutine profile 文件,然后利用3个命令 top、traces、list 定位内存泄露的原因。
goroutine 泄露的场景
泄露的场景不仅限于以下两类,但因channel相关的泄露是最多的。
- channel 的读或者写:
- 无缓冲 channel 的阻塞通常是写操作因为没有读而阻塞
- 有缓冲的 channel 因为缓冲区满了,写操作阻塞
- 期待从 channel 读数据,结果没有 goroutine 写
- select 操作,select 里也是 channel 操作,如果所有 case 上的操作阻塞,goroutine 也无法继续执行。
编码 goroutine 泄露的建议
为避免 goroutine 泄露造成内存泄露,启动 goroutine 前要思考清楚:
- goroutine 如何退出?
- 是否会有阻塞造成无法退出?如果有,那么这个路径是否会创建大量的 goroutine?
本文作者:大彬